Power BI Certification Course Overview
Power BI certification training will help you get the most out of Power BI, enabling you to solve business problems and improve operations. This course helps you master the development of dashboards from published reports, discover better insight from the data, & create practical recipes on the various tasks that you can do with Microsoft Power BI.
An overview of Power BI and its features, including the different components and functionalities of the tool. This section introduces participants to the Power BI ecosystem and its capabilities.
Power Bi Certification Training Course Key Features
At Fiesttech, we value the trust of our patrons immensely. But, if you feel that this Power Bi Certification Training Course does not meet your expectations, we offer a 7-day money-back guarantee. Just send us a refund request via email within 7 days of purchase and we will refund 100% of your payment, no questions asked!
- 6 hours of enriched learning
- Lifetime access to self-paced learning
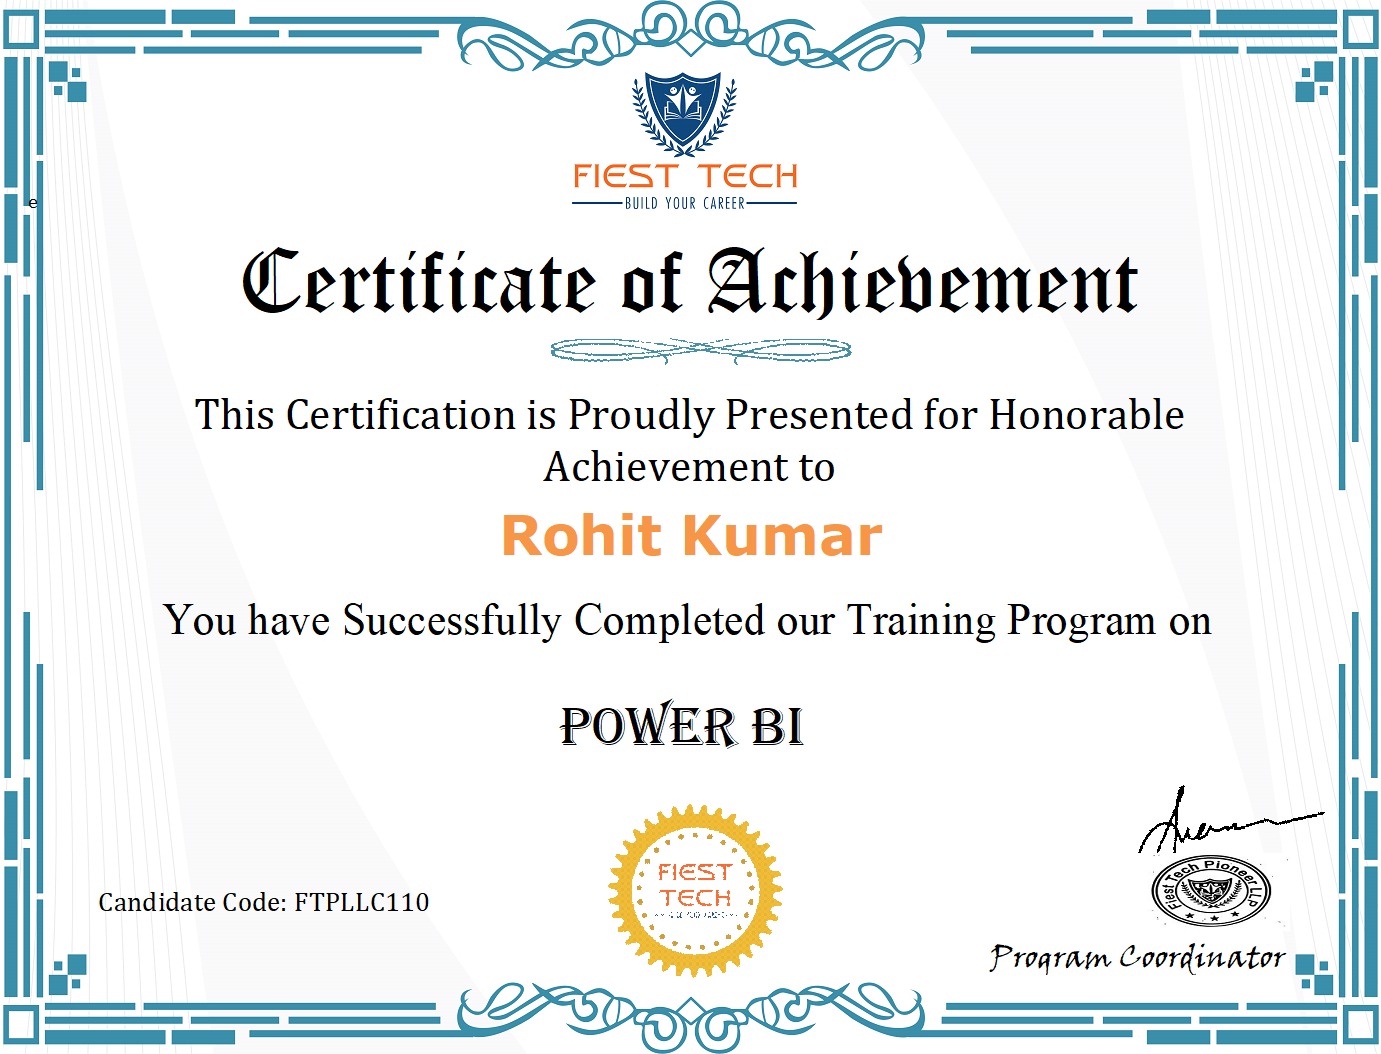
- Industry-recognized course completion certificate
- Data Transformation and Modeling
- Interactive Dashboards and Reports
- Data Analysis and Exploration
Skills Covered
- Desktop layout
- Builtin aggregations
- Reports and dashboards
- DAX commands and functions
- Data Refresh and Scheduled Updates
- Integration with Other Tools
- Advanced Topics
- Hands-on Experience
Benefits
The global Business Intelligence market size to grow from USD 23.1 billion in 2020 to USD 33.3 billion by 2025, at a Compound Annual Growth Rate (CAGR) of 7.6% during the forecast period[Market Research Report,2020]. Power BI proficiency can open doors to new career opportunities and advancement within your current organization. It can lead to roles with more significant responsibilities and potentially higher salaries.
Annual Salary
Hiring Companies
Annual Salary
Hiring Companies
Annual Salary
Hiring Companies
GO AT YOUR OWN PACE
Training Options
Explore all of our training options and pick your suitable ones to enroll and start learning with us! We ensure that you will never regret it!
Power BI Course Curriculum
Eligibility
No specific educational qualifications are required, but participants should have at least a high school diploma or equivalent. Participants should have basic computer skills, including familiarity with file management, web browsing, and general software usage. Participants should have access to a computer with Power BI Desktop installed. You can provide guidance on where to download and install Power BI Desktop if needed.
Pre-requisites
Participants should have a foundational understanding of Microsoft Excel, including concepts like worksheets, cells, and basic formulas. This knowledge will help bridge the gap between Excel and Power BI. Familiarity with basic data concepts such as tables, columns, rows, and data relationships can be advantageous. While not mandatory, having a basic understanding of the business domain in which participants work or plan to work can enhance their ability to apply Power BI effectively.
Course Content
Live Course
Self Paced
-
1.01 - Lesson 01: Course Introduction
16:11 -
1.02 - 1.01 Welcome to Power BI Course
00:25 -
1.03 - 1.02 Skills Covered
02:32 -
1.04 - 1.03 Business Intelligence and Data Analytics High level Overview
06:07 -
1.05 - 1.04 Introduction to Power BI
02:32 -
1.06 - 1.05 Different Power BI Offerings
02:32 -
1.07 - 1.06 Installing Power BI
02:32
-
2.01 - 2.01 Identify and Connect to a Data Source
02:32 -
2.02 - 2.02 Change Data Source Settings
01:12 -
2.03 - 2.03 Select a Shared Dataset
01:32 -
2.04 - 2.04 Select a Storage Mode
02:32 -
2.05 - 2.05 Choose an Appropriate Query Type
01:32 -
2.06 - 2.06 Use Microsoft Dataverse
01:43 -
2.07 - 2.07 Use Parameters
02:43 -
2.08 - 2.08 Use or Create a PBIDS file
01:32
-
4.01 - 4.01 Resolve Inconsistencies Unexpected or Null Values and Data Quality Issues
03:32 -
4.02 - 4.02 Apply User friendly Value Replacements
02:32 -
4.03 - 4.03 Evaluate and Transform Column Data Types
02:43 -
4.04 - 4.04 Apply Data Shape Transformations to Table Structures
02:45 -
4.05 - 4.05 Combine Queries
01:32 -
4.06 - 4.06 Apply User friendly Naming Conventions to Columns and Queries
01:26 -
4.07 - 4.07 Leverage Advanced Editor to Modify Power Query M code
01:21
-
6.01 - 6.01 Apply Cross filter Direction and Security Filtering
05:44 -
6.02 - 6.01 Apply Cross filter Direction and Security Filtering
05:44 -
6.03 - 6.02 Create Calculated Tables
01:32 -
6.04 - 6.03 Create Calculated Columns
03:32 -
6.05 - 6.04 Implement Row level Security Roles
01:12 -
6.06 - 6.05 Set up the Q and A Feature
02:32
-
7.01 - 7.01 Remove Unnecessary Rows and Columns
02:23 -
7.02 - 7.02 Identify Poorly Performing Measures Relationships and Visuals
01:26 -
7.03 - 7.03 Improve Cardinality Levels
01:35 -
7.04 - 7.04 Optimize DirectQuery Models
01:04 -
7.05 - 7.05 Create and Manage Aggregations
02:32 -
7.06 - 7.06 Use Query Diagnostics
03:32
-
11.01 - 11.01 Identify Outliers
01:21 -
11.02 - 11.02 Conduct Time Series Analysis
01:21 -
11.03 - 11.03 Use Groupings and Binnings
01:12 -
11.04 - 11.04 Use the Key Influencers to Explore Dimensional Variances
01:21 -
11.05 - 11.05 Use the Decomposition Tree Visual to Break Down a Measure
00:54 -
11.06 - 11.06 Apply AI Insights
01:12

Power Bi Certification Training Course Exam & Certification
Professionals need to be well-versed in using different functionalities of Power BI and which visualization would fit best for a given data set to become a Power BI developer. This Power BI certification course is all you need to gain all the required skills.
The Microsoft Power BI certification exam tests your skills in the following domains: Consuming and Transforming Data By Using Power BI Desktop (20-25%) Modeling and Visualizing Data (45-50%) Configure Dashboards, Reports, and Apps in the Power BI Service (25-35%)
The cost of Exam 70-778: Analyzing and Visualizing Data with Microsoft Power BI is $165 USD.
Yes, we provide a practice test as part of our Power BI course to help you prepare for the certification exam. You can try this free Power BI Exam Questions Practice Test to understand the type of questions that you would face in the certification exam and gain expertise in the topics that are a part of the Power BI course syllabus.
The ideal candidates are BI professionals, data analysts, and other roles responsible for creating reports using Power BI.
To obtain the Power BI course completion certificate, you must complete the Power BI online training.
FAQS
Power Bi Certification Training Course Course FAQs
Power BI is a business analytics solution owned by Microsoft. Analysts use it for data visualization, draw insights from it, and share the dashboards and visual reports across the organization. Moreover, one can access these reports sitting at their workplace or anywhere through Power BI apps offered by Microsoft.
DAX refers to Data Analysis Expressions, a formula language that is used throughout Power BI. It is a library of functions and operators that can be combined to create formulas and expressions in Power BI.
You can either enroll in our Data Scientist Course or Data Analyst Course if you are looking to get a University certificate, you can enroll in the Post Graduate Program in Data Science or Post Graduate Program in Data Analytics.
Tableau, Power BI, FusionChart, D3, Infogram, ChartBlocks, Google Charts are some other Data Visualization tools popular in the market.
Yes, our Power BI certification course training material is aligned with the syllabus of the Microsoft Power BI certification exam and helps you pass it in your first try.
Power BI is primarily a business analytics solution used to run reports, visualize data, and share valuable insights in a secured manner across the various teams in an organization or embed the acquired information into an organization's app or website.With the help of Simplilearn’s Power BI course, you will be able to gain a detailed insight into the applications of Power BI and know its importance.
No, this Power BI course is a simple one allowing professionals to learn about various concepts of Power BI easily. The course is best suited for BI and reporting professionals, data analysts, and professionals working with data across multiple industries.
With a Power BI certification, you can have a rewarding career. As per one of the reports by MarketsandMarkets, the Business Intelligence Market is projected to reach $33.3 billion by 2025, promising a bright future for BI professionals. Also, BI professionals earn an average salary of $88,000, which is much more than other IT or business professionals. Considering all these factors, without any doubt, we can say that business intelligence is a good career option.
A Power BI developer is primarily involved in designing and developing BI reports and offers valuable insights to help the organization make informed and better decisions. The job role of a Power BI requires professionals to have a deep understanding of business intelligence, data integration, data warehousing, data modeling, database, and various technical aspects of Business intelligence tools. With the right Power BI certification, professionals can learn how to perform these roles and responsibilities efficiently.
Yes, acquiring a Power BI certification is worth it. With the help of this Power BI training, you will gain all the necessary skills to run Power BI tools. By gaining specialization in designing calculated tables and columns, managing a firm's hierarchies, and processing data, you can get an edge over others and add value to your resume.
Power BI developers need to have a deep knowledge of SQL and Java and possess skills like DAX expressions BI stack knowledge, data analytics, and software development. Furthermore, they must have prior experience with BI tools such as Power BI, Tableau, SAP. Apart from technical skills, they must have non-technical skills, like collaborating with teams, being self-driven, leading a team, and exceptional communication and management skills. With this Power BI certification course, you can easily gain these skills and implement them while working.
Power BI is most prevalent across Industries like retail, manufacturing, real estate, insurance, healthcare, and energy utility. Upon completing this Power BI course, you can easily seek employment opportunities in one of these top industries.
As per PayScale.com, the average salary of a professional with Power BI certification is $75885 annually.
Some of the most resourceful books recommended for seeking in-depth knowledge on Business intelligence are:
- Business Intelligence Guidebook: From Data Integration to Analytics written by Rick Sherman
- Data Strategy was written by Bernard Marr
- Agile Data Warehouse Design written by Lawrence Corr and Jim Stagnitto
- Successful Business Intelligence written by Cindi Howson
- Business Intelligence – Da Informação ao Conhecimento written by Maribel Yasmina Santos and Isabel Ramos
While seeking this online Power BI training, reading these books will add on to your knowledge and have a comprehensive learning experience.
Related Programs
Data Science & Business Analytics Related Programs

